The State of Our Climate
Temperature
James Hansen, Columbia,multiple temperature data sets (most comprehensive)
NASA GISS is good for temperature data with maps, aso vital climate signs
Copernicus is excellent from the European Commission for global and European temperature
NOAA US source for global and US temperature data, as well atmospheric GHGs
Berkely Earth Excellent US global temperature site
NASA GISS is good for temperature data with maps, aso vital climate signs
Copernicus is excellent from the European Commission for global and European temperature
NOAA US source for global and US temperature data, as well atmospheric GHGs
Berkely Earth Excellent US global temperature site
State of Our Climate


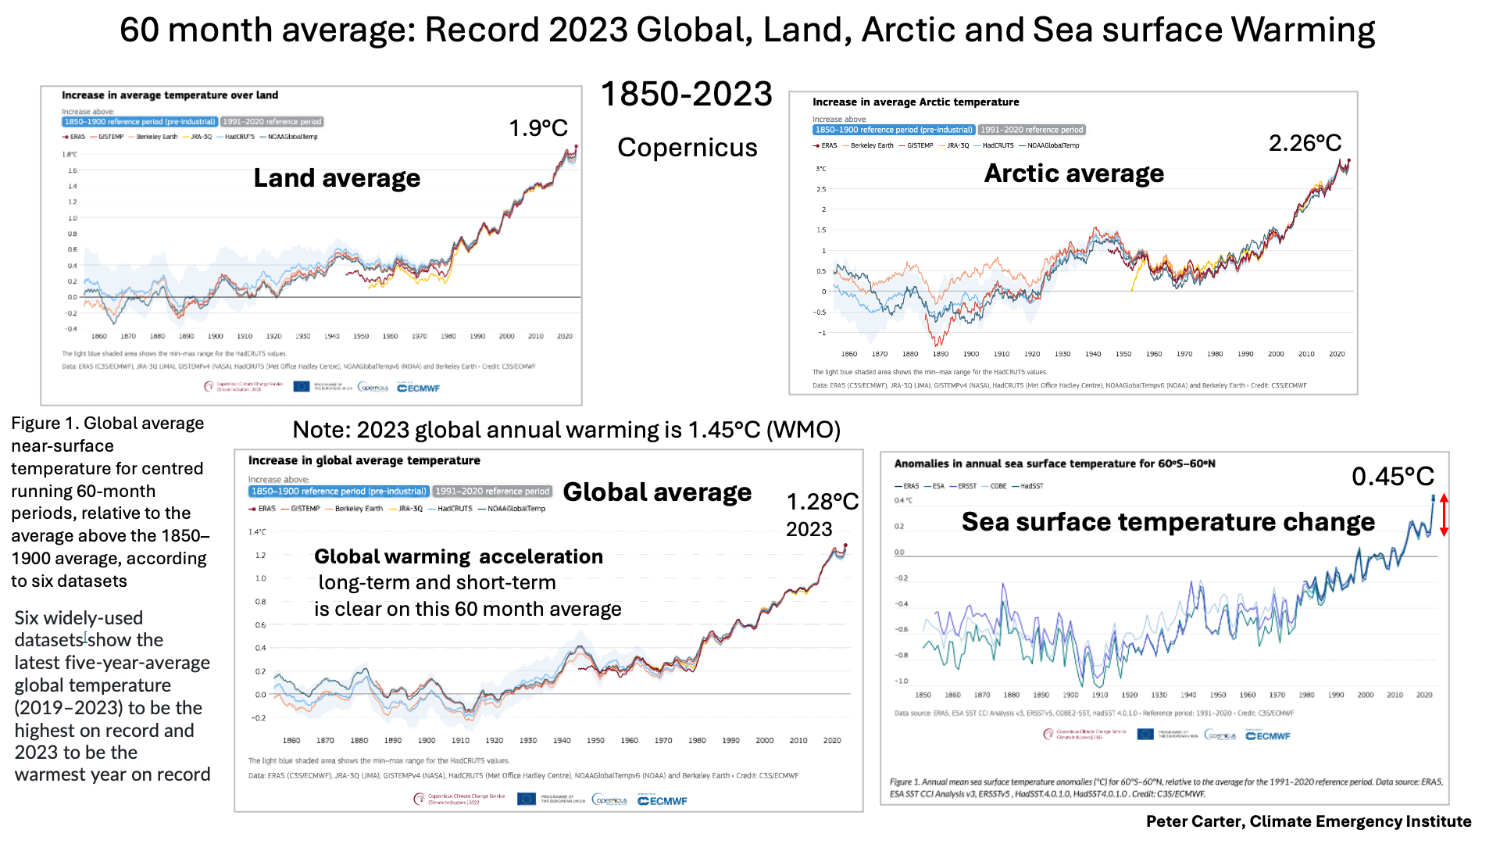
60 month averages from Copernicus
The long 60 months results in a lower 2023 warming.
Here, it shows the differences of the global average to northern hemisphere, Arctic and sea surface.
The long 60 months results in a lower 2023 warming.
Here, it shows the differences of the global average to northern hemisphere, Arctic and sea surface.
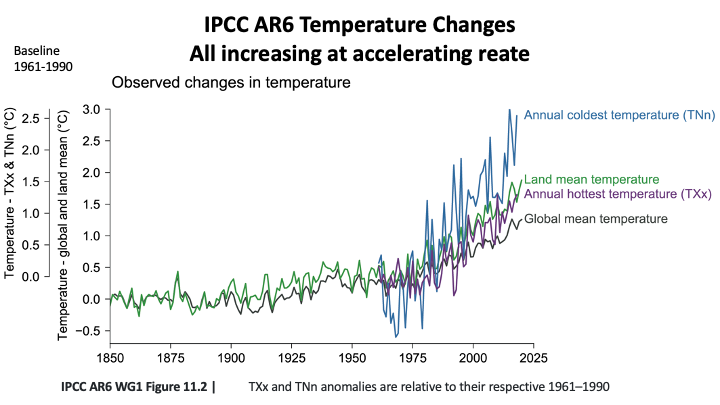
IPCC 6th Assessment
Coldest temperature
Mean land temperature
Global hottest temperature
Global mean temperature
Coldest temperature
Mean land temperature
Global hottest temperature
Global mean temperature
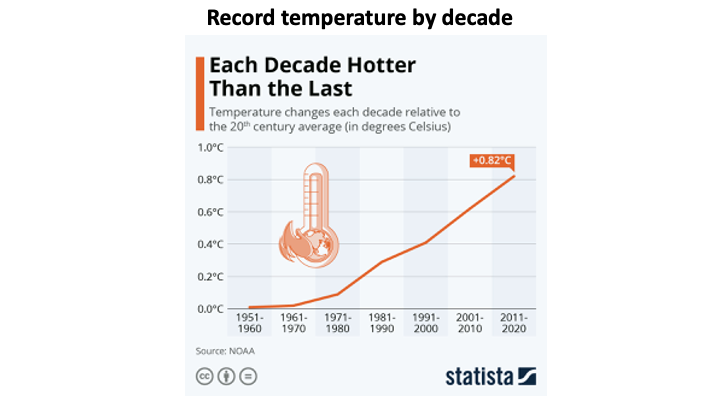
All record high, increasing
at accelerating rates
at accelerating rates
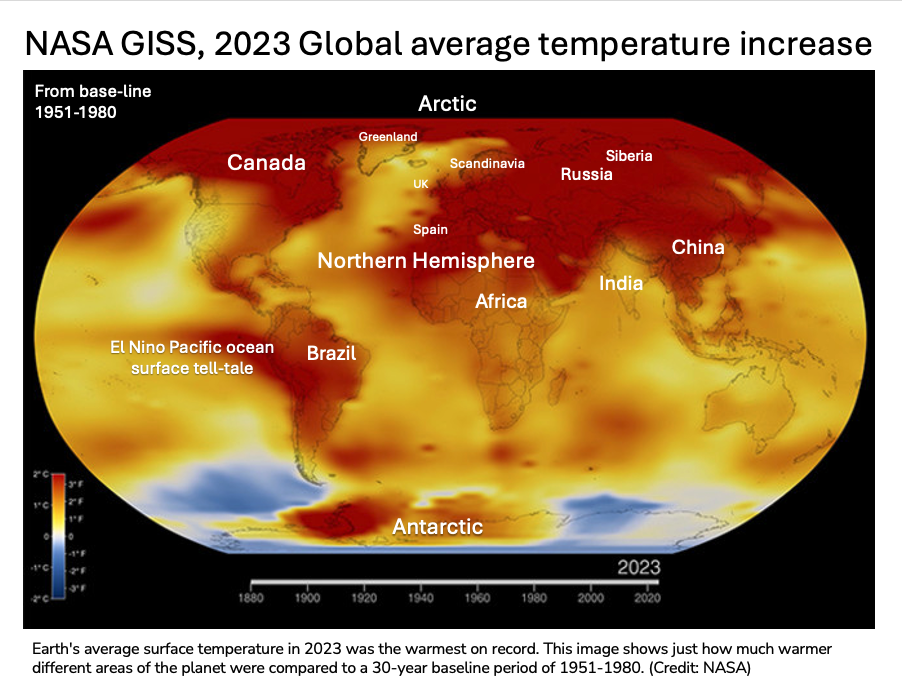
2023 was a record average temperature increase) year of 1.45°C (WMO).
The actual temperature was 14.98°C, boosted by a strong La Nina.
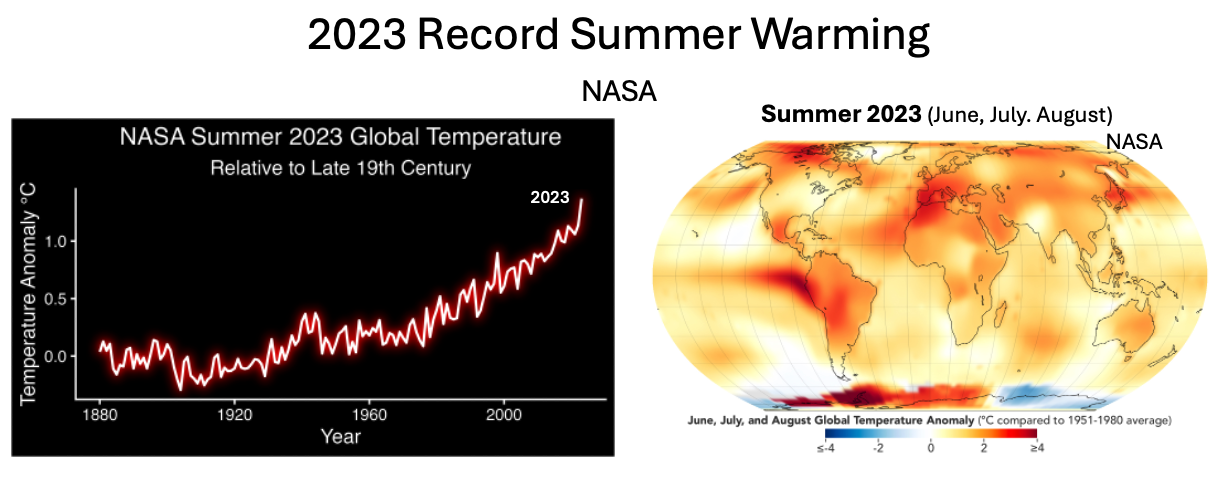
Arctic 2023 Summer was the Arctic's hottest on record. Some areas at 7.2°F above 1991-2020. Arctic Warming has accelerated in recent decades,
Global warming is defined as an increase in combined surface
air and sea surface temperatures averaged over the globe
and over a 30-year period (IPCC).
(The long 30 year period is used to determine trends)
Expressed relative to 1850–1900, pre-industrial temperatures (IPCC).
Normally we are given the land-sea surface average (sea surface is relatively cooling to global warming) averaged over the last year
Normally we are given the land-sea surface average (sea surface is relatively cooling to global warming) averaged over the last year
Strictly speaking global warming
causes climate change.
causes climate change.
Global surface warming causes the increasing heat waves, wildfires, drought.
It is generally used as the sole indicator of how the climate is changing (being changed). As such, it is a poor single indicator, and the 1992 UN climate change convention has atmospheric greenhouse gas concentrations as the indicator of climate system danger.
Global warming is only a tiny amount of the heat being added to the climate system by GHGs, because most of the added heat goes straight to the oceans (over 90%).
We are generally now not given the value from pre-industrial, usually the 20th century global average, which of course is lower than from 1850-1900. Pre-industral is the reference for the policy limits to global temperature increase. Since the mid 1990s the policy limit was 2°C. Following the 2018 IPCC 1.5°C Special Report comparing 1.5°C with 2°C, everyone took 1.5°C as the danger limit.
The rate of warming is as important as the degree.The faster the rate of warming is the faster is the mitigation needed and the harder (less successful) is adaptation.
Global temperature increase is accelerating on the long term and short term.
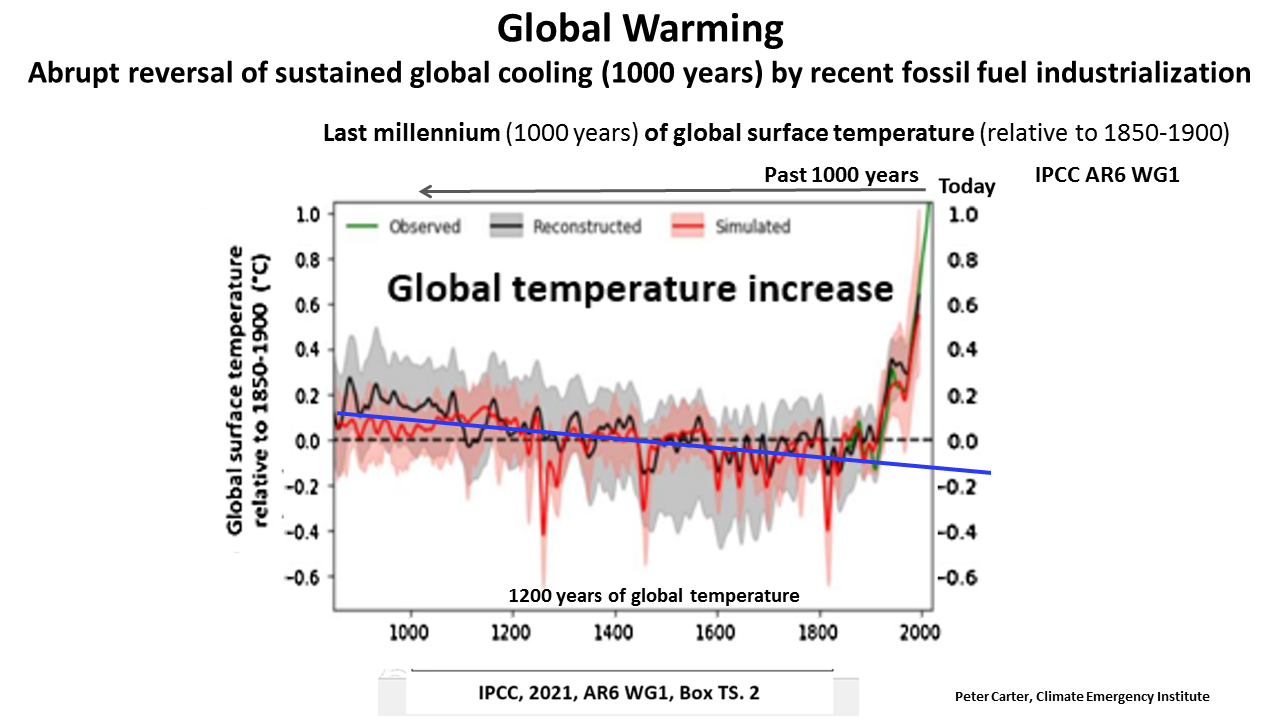
An initial global cooling from mid 1800s was reversed to warming around 1910. Rate of warming slowedfrom 1940 to 1960. The reason is not certain,
but did have to do with how the measurements were taken.
Global warming is speeding up.
From 1980 warming increased and has been a
fairly steady very rapid warming from 1990.
Close examination shows it sped up around 2010
and again 2020, so it is accelerating.
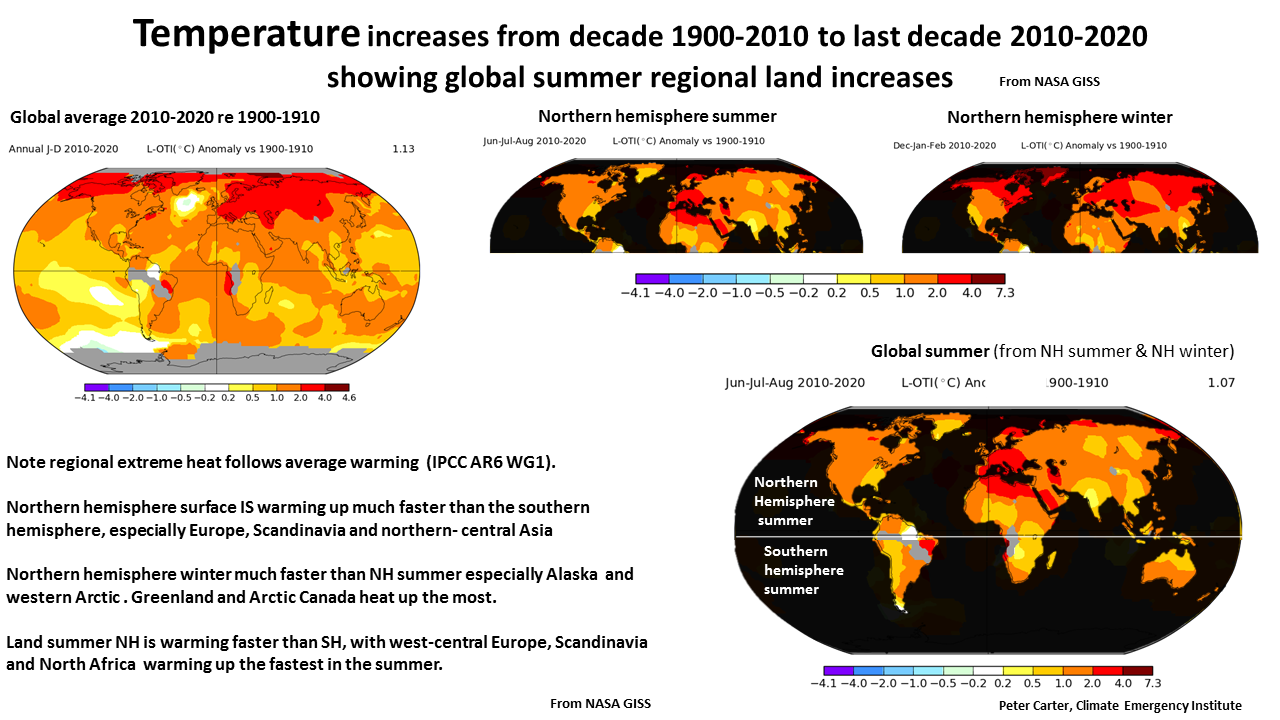
Land warms faster than ocean surface.
Northern hemisphere warms faster than Southern (mostly ocean).
Central continents warm faster.
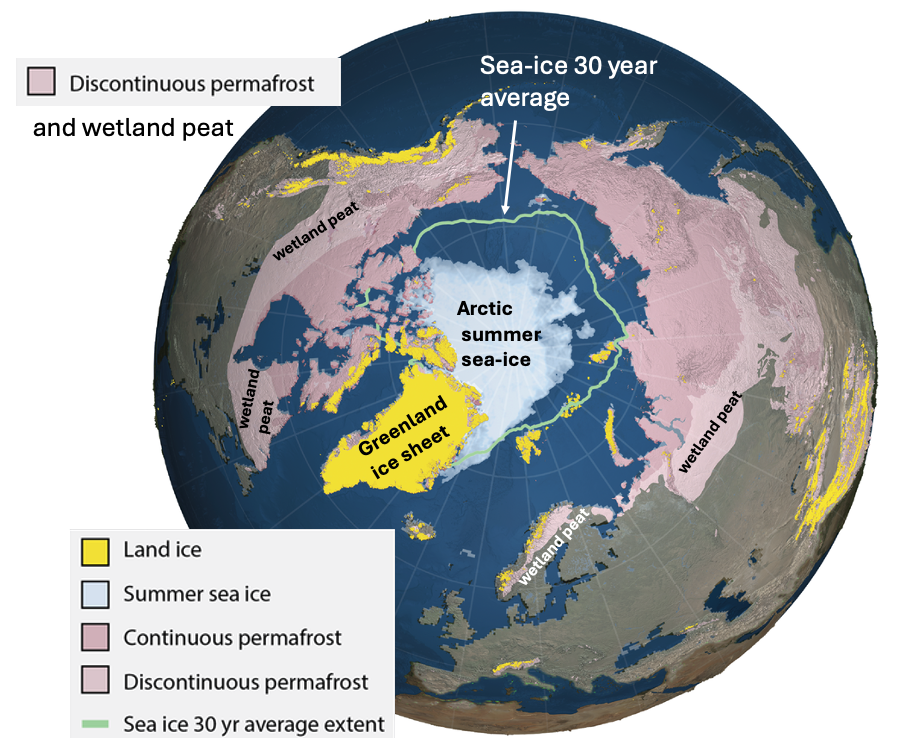
Arctic warms fastest of all, nearly four times global average
Arctic warming is 3 to 4X rest of the planet.
It matters a lot because of the many large sources of amplifying feedback, like melting of summer Arctic sea ice and thawing permafrost.
It matters a lot because of the many large sources of amplifying feedback, like melting of summer Arctic sea ice and thawing permafrost.
Northern hemisphere matters a lot as most ot our best food producing regions are northern hemisphere, and it holds 87% of the world population
2023 was a big record global warming of 1.45°C by WMO (also NASA GISS). The exact degree of warming varies slightly amongst the climate centers. The WMO provides their average. Global warming is affected by the El Nino/La Nina
oscillation (ENSO), El Nino tending to be warmer and La Nina cooler.
oscillation (ENSO), El Nino tending to be warmer and La Nina cooler.
The most important for us regarding climate change impacts (to us) Summer land temperature increase, which is seldom found.
Global Temperature in the Past

Past 1000 years
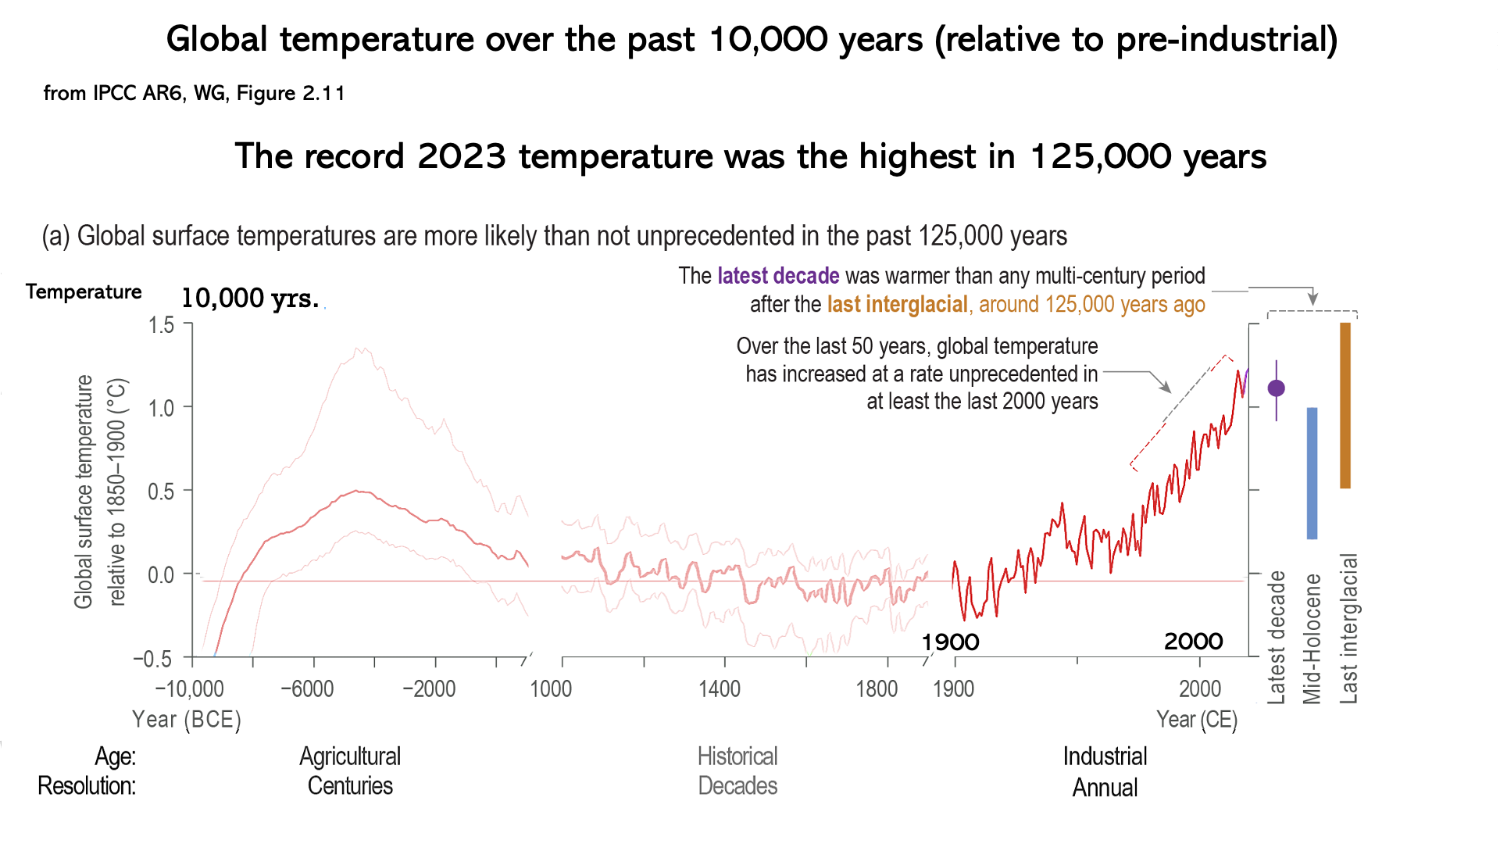

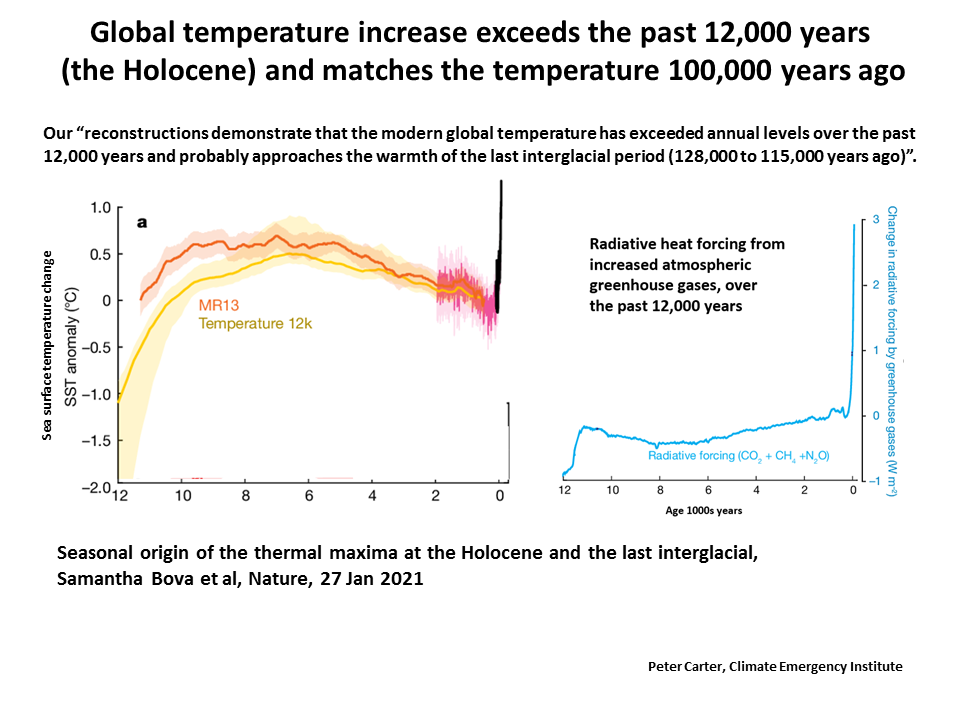
Past 10,000 years
Past 20,000 years
2023 highest temperature
in 125,000 yrs
in 125,000 yrs
Large Arctic amplifying feedback sources
triggered by temperature increase and time
triggered by temperature increase and time
The large amplifying feedbacks
(tipping systems) are triggered
by 2°C (2018, Trajectories of the
Anthropocene, Will Steffen)
(tipping systems) are triggered
by 2°C (2018, Trajectories of the
Anthropocene, Will Steffen)
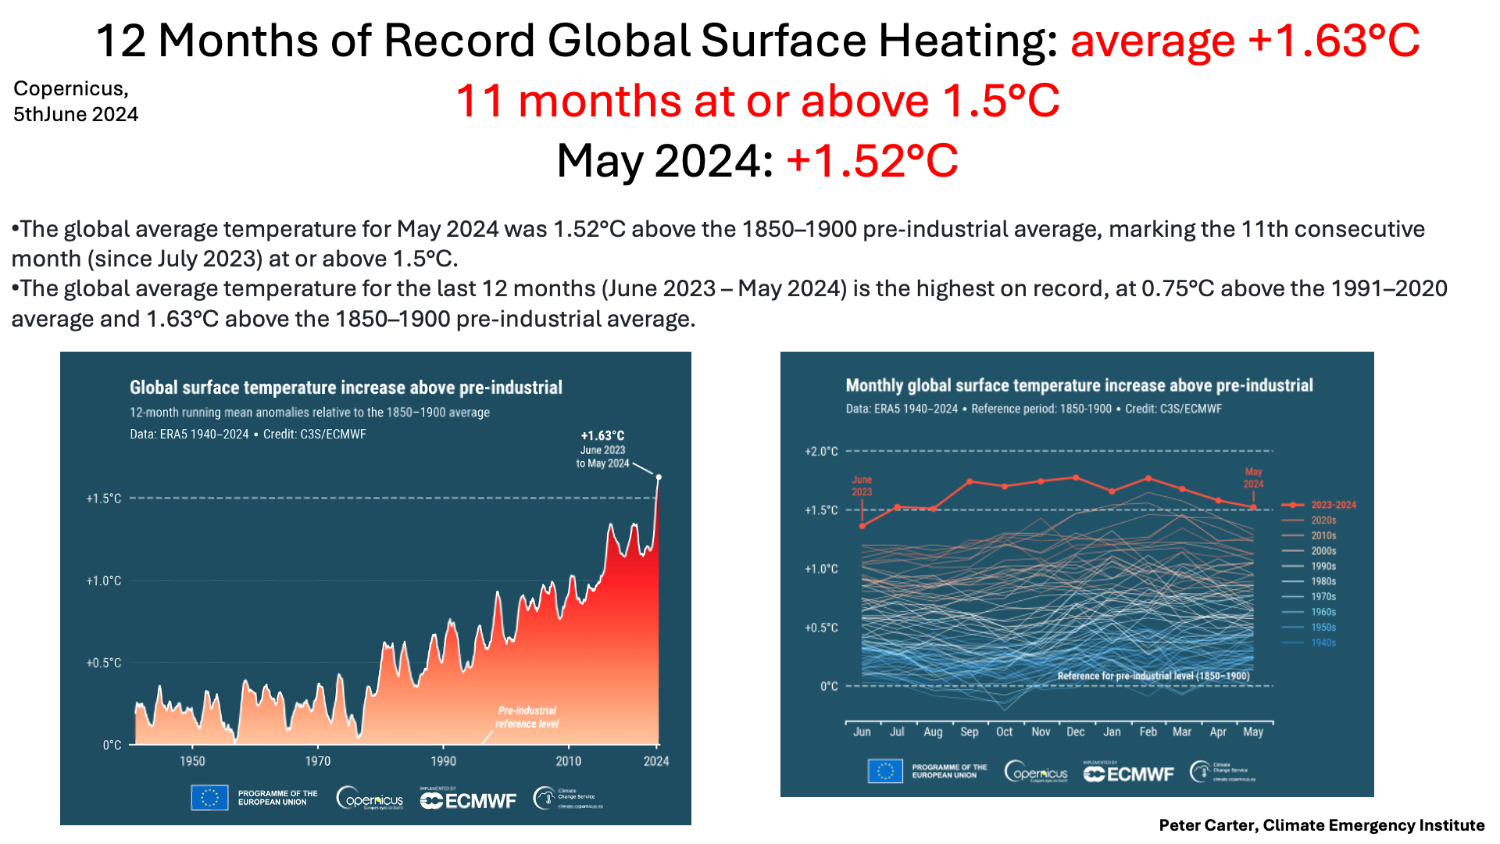
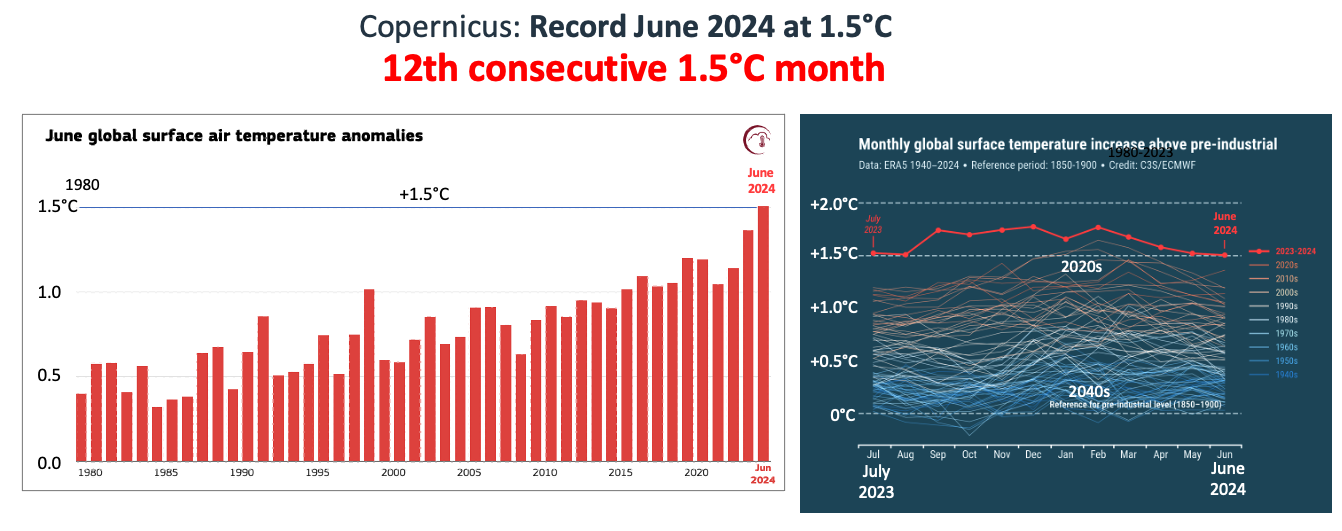
June 2024: Month of records
13 months of record warming
12 months at/above 1.5°C
(Copernicus)
13 months of record warming
12 months at/above 1.5°C
(Copernicus)

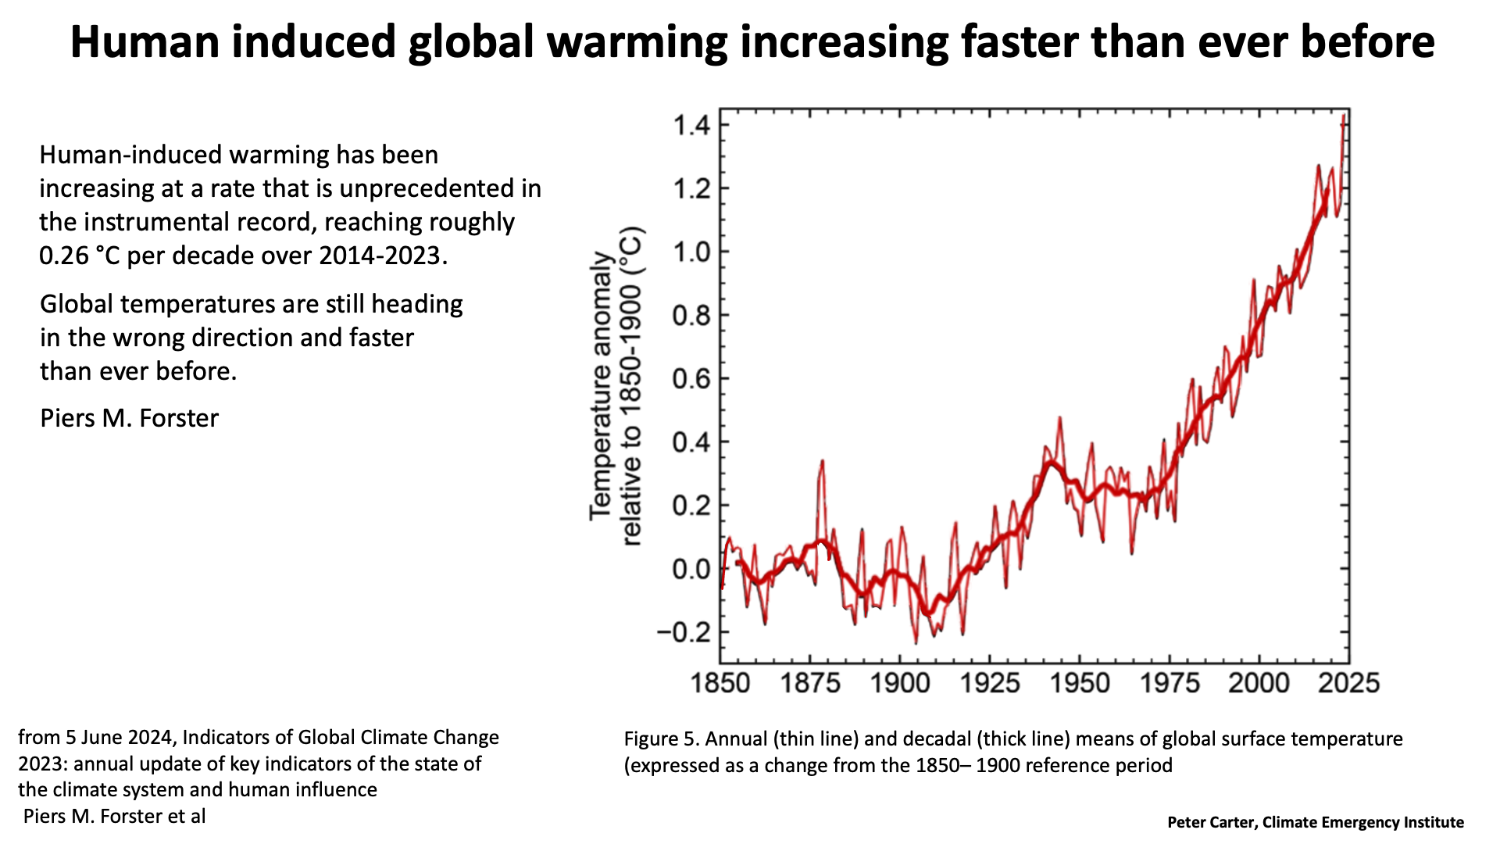
2024, Global warming is increasing
faster than ever (June 2024 Forster)
at an unprecented rate
faster than ever (June 2024 Forster)
at an unprecented rate
1900 global temperature 13.7°C