Preindustrial CO2: 278 ppm
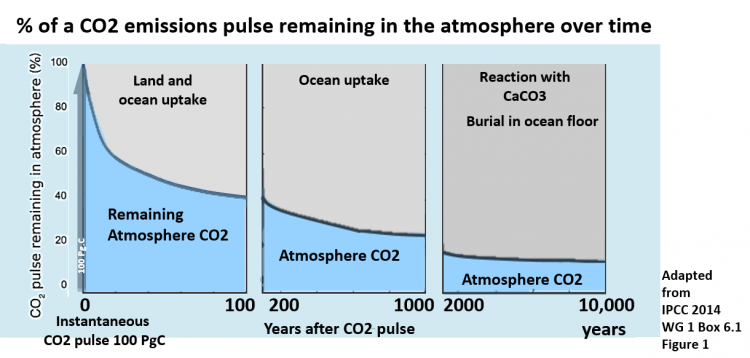
CO2 emissions are cumulative in the atmosphere due to ultra-long CO2 atmospheric life-time 20% remains at 1000 years. CDIAC mean CO2 liftetime is 200 years

NOAA ESRL Greenhouse gas concentrations
July 2025 Atmospheric CO2: 427.45 ppm NOAA
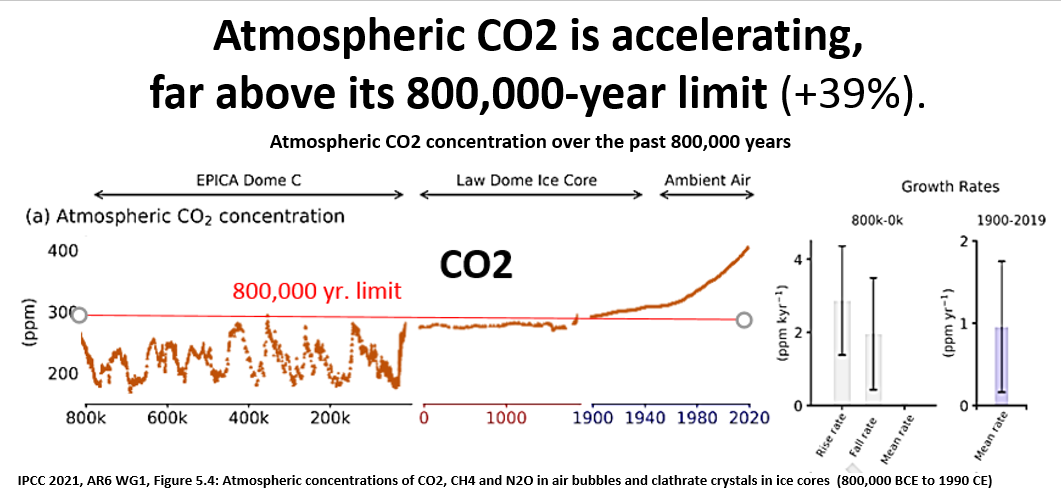
IPCC AR6: Unprecedented rate of atmospheric CO2 increase
Multiple lines of evidence show that the rate at which CO2 has increased in the atmosphere during 1900–2019 is at least 10 times faster than at any other time during the last 800,000 years, and 4–5 times faster than during the last 56 million years
(IPCC AR6, WG1, 5-676) Exec Summary
Multiple lines of evidence show that the rate at which CO2 has increased in the atmosphere during 1900–2019 is at least 10 times faster than at any other time during the last 800,000 years, and 4–5 times faster than during the last 56 million years
(IPCC AR6, WG1, 5-676) Exec Summary
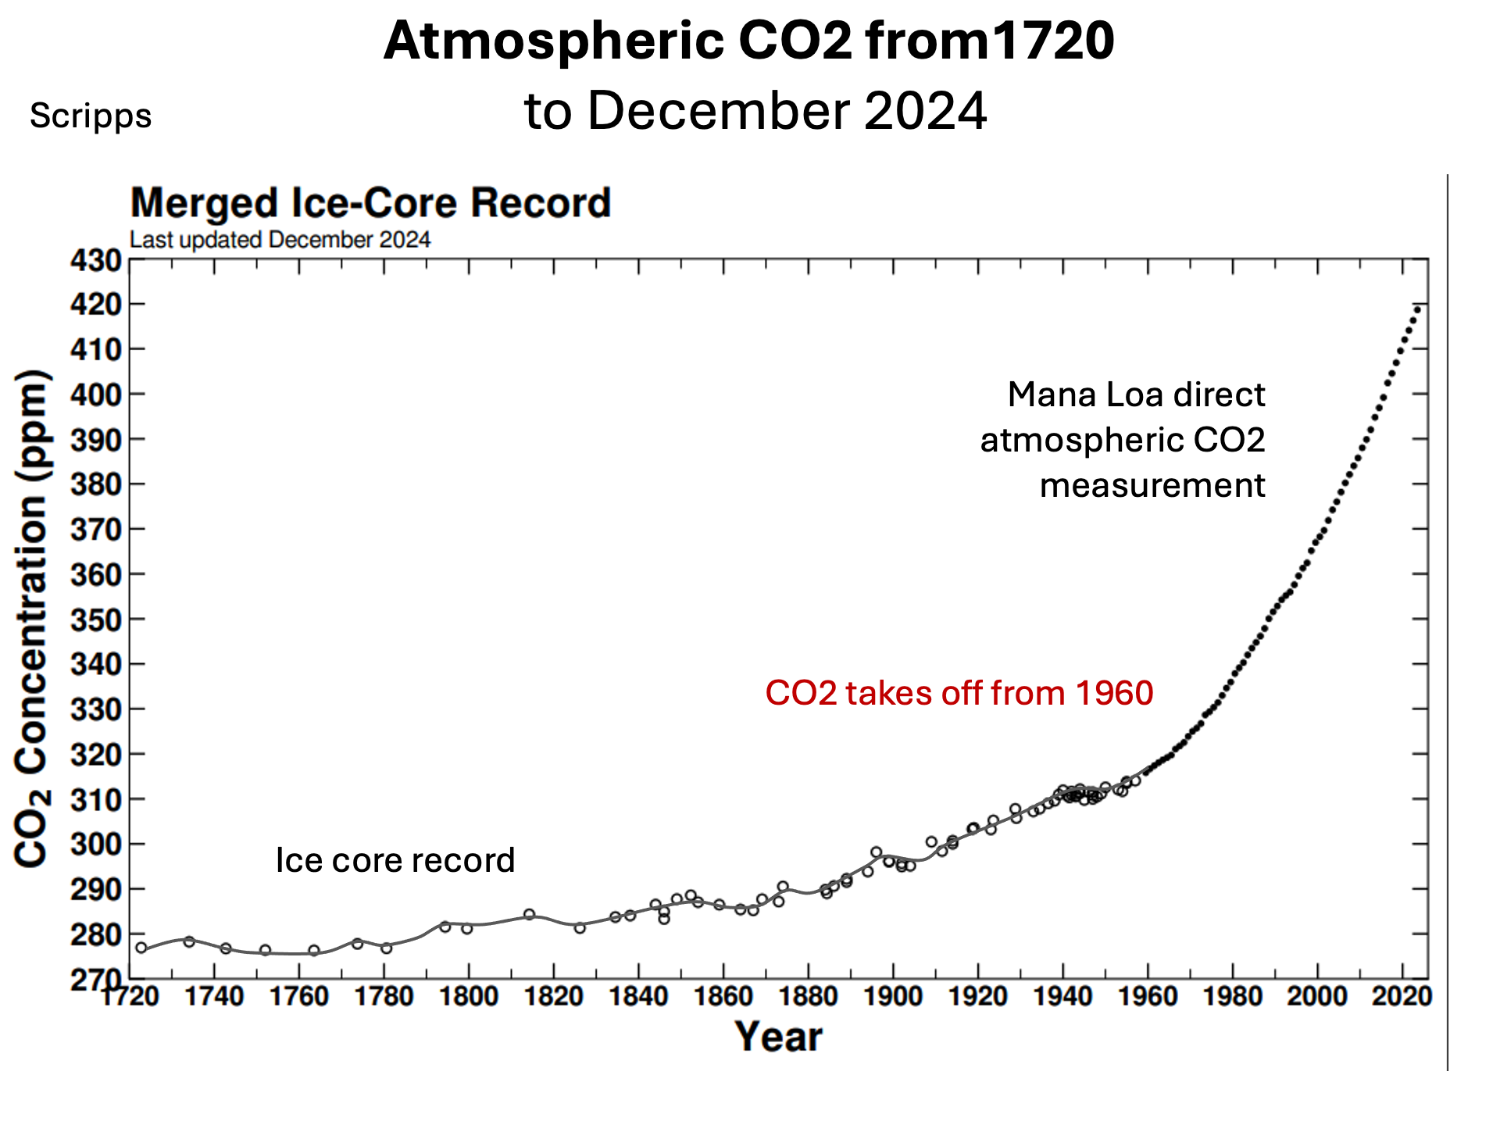
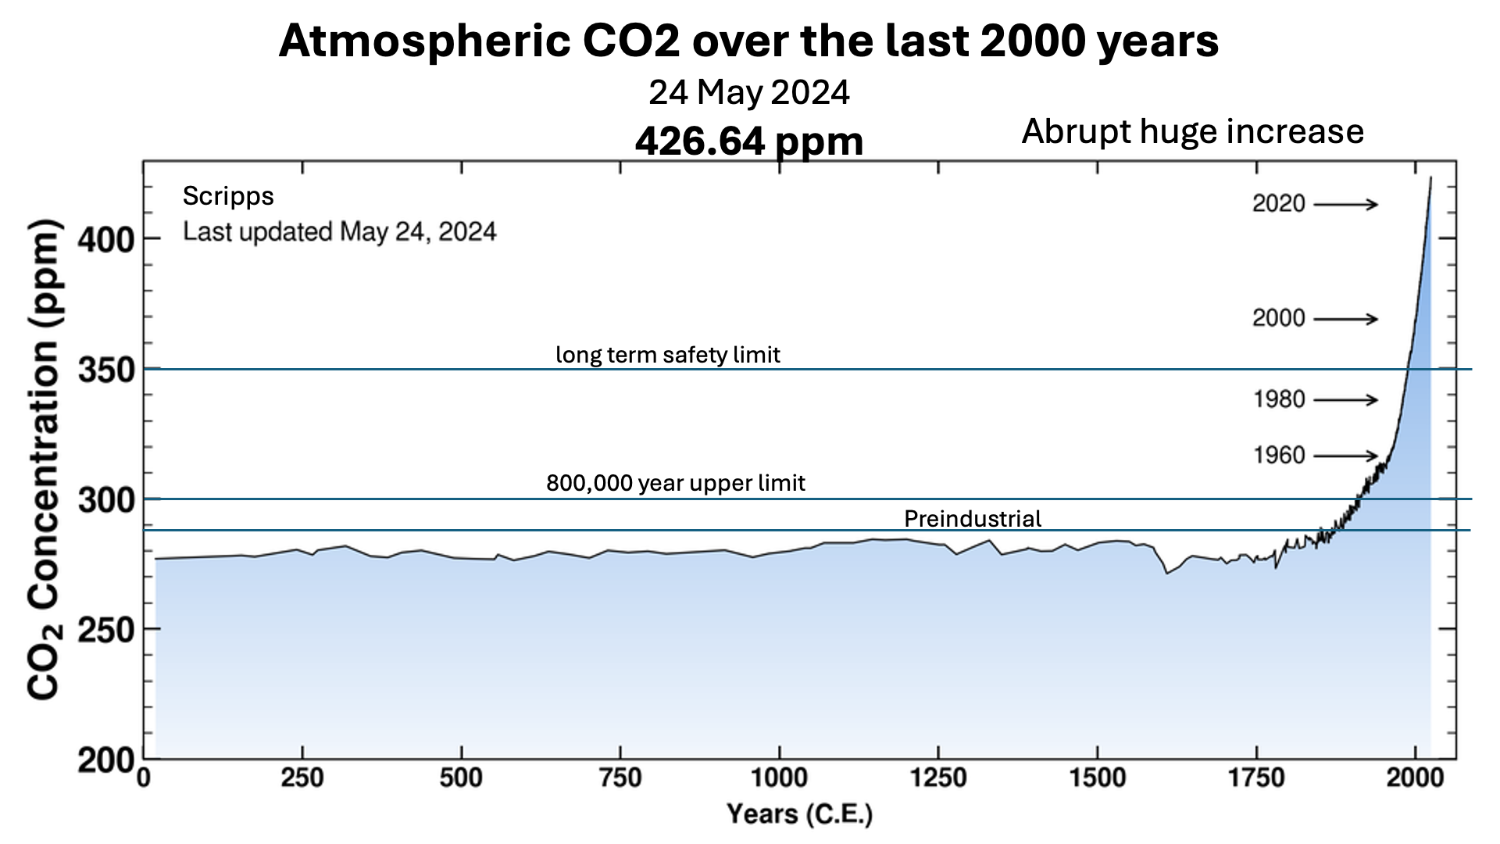
CO2 past 2000 years
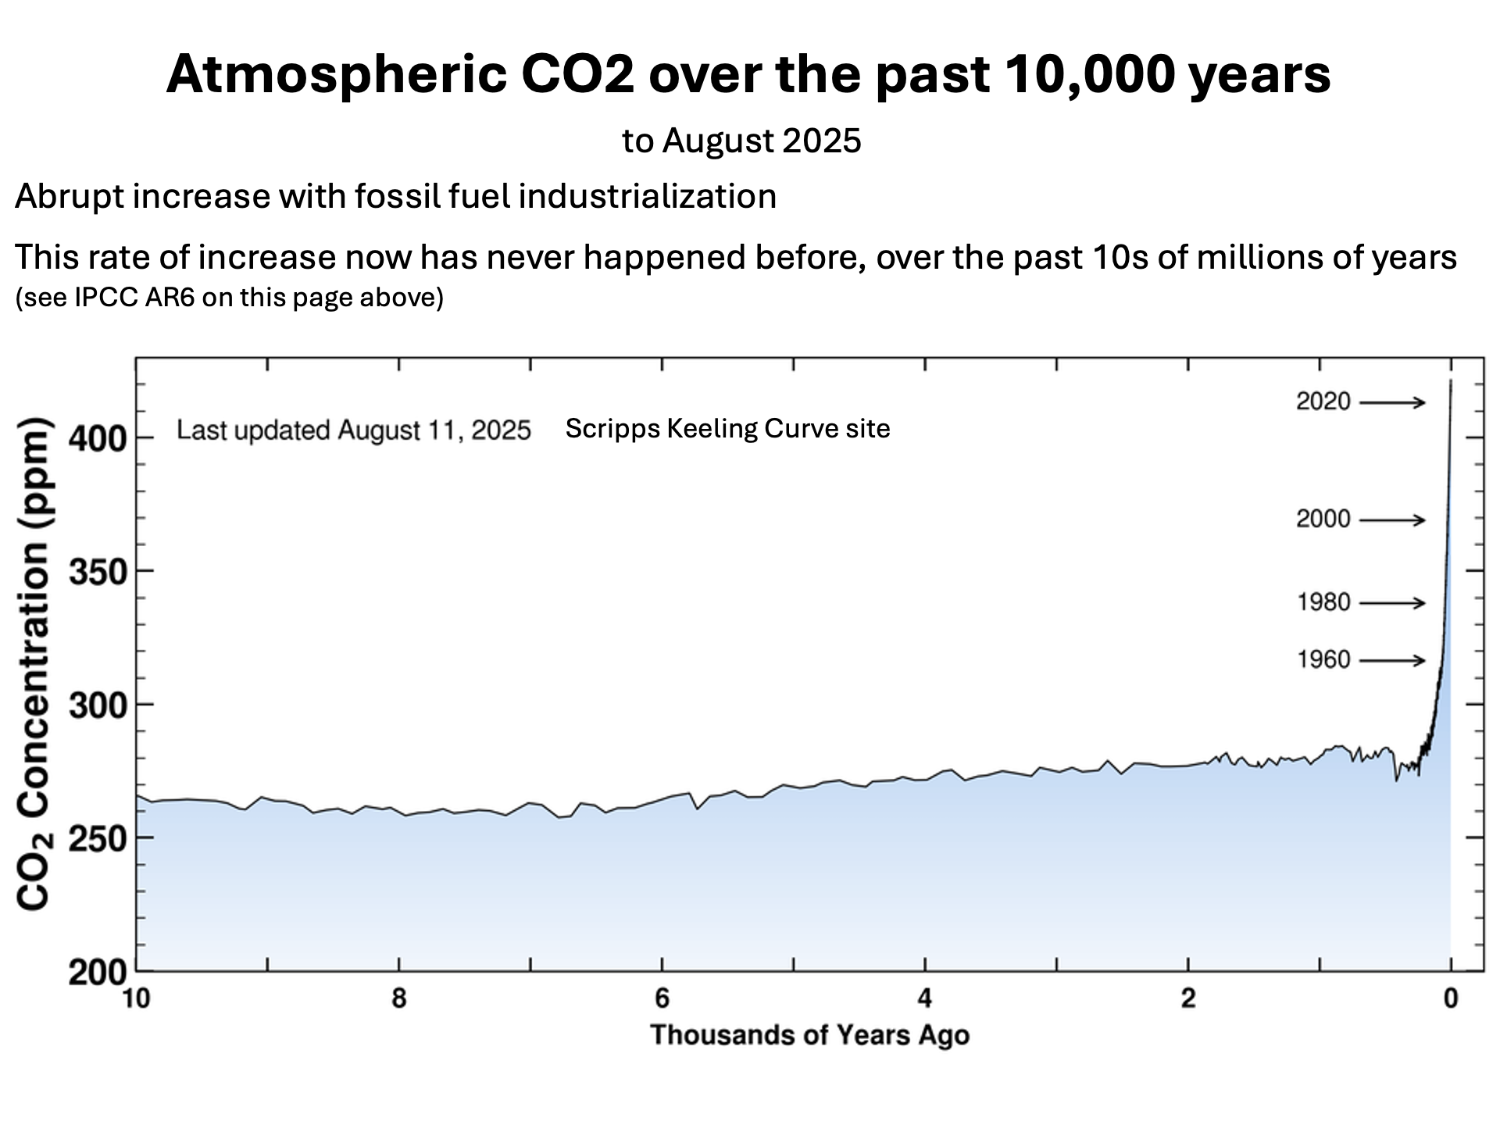
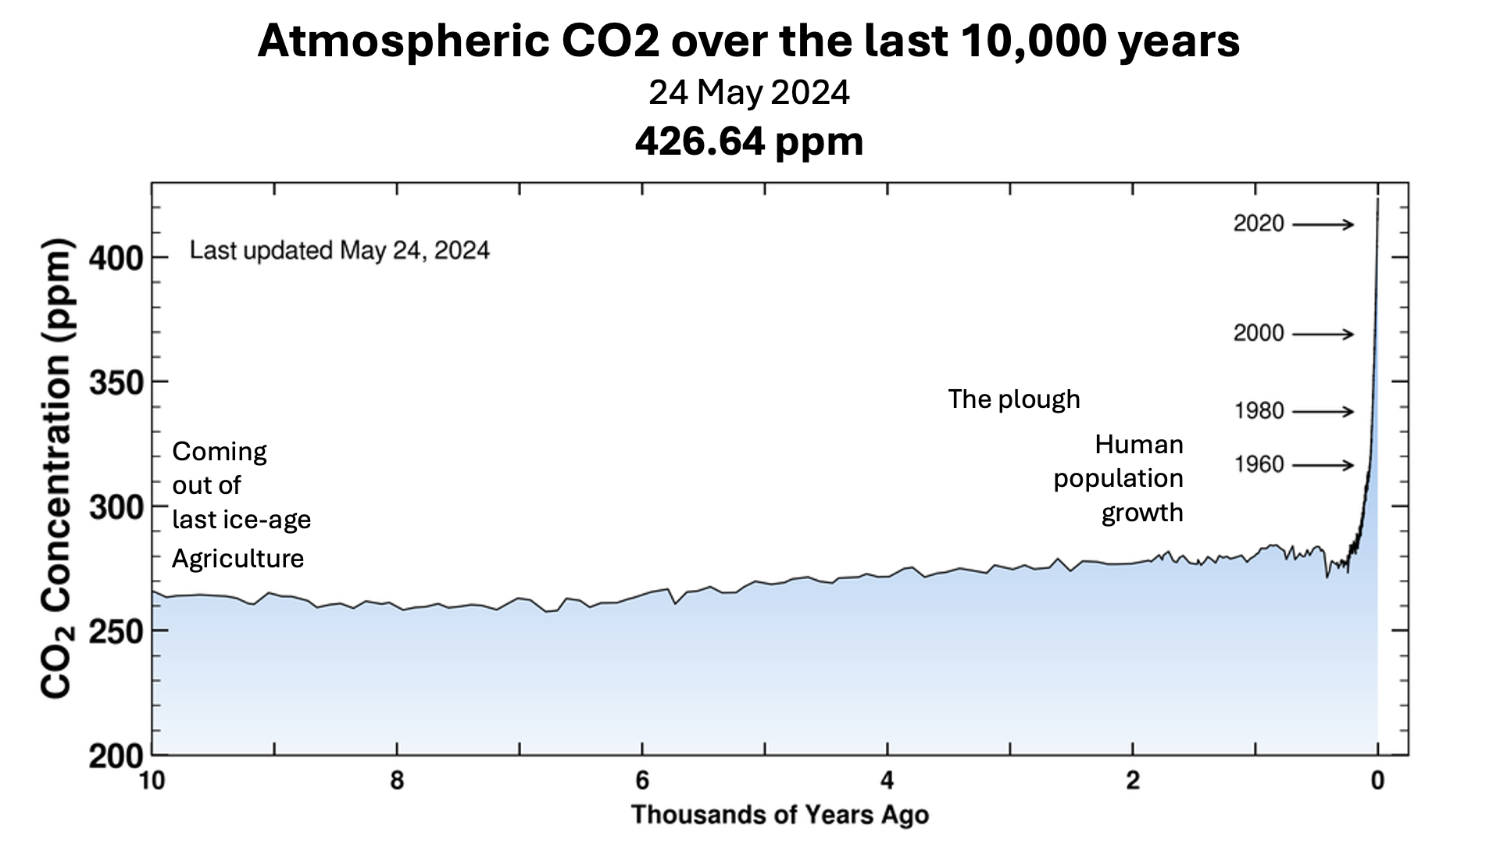
Abrupt increase with fossil fuel industrialization
Abrupt increase with fossil fuel industrialization
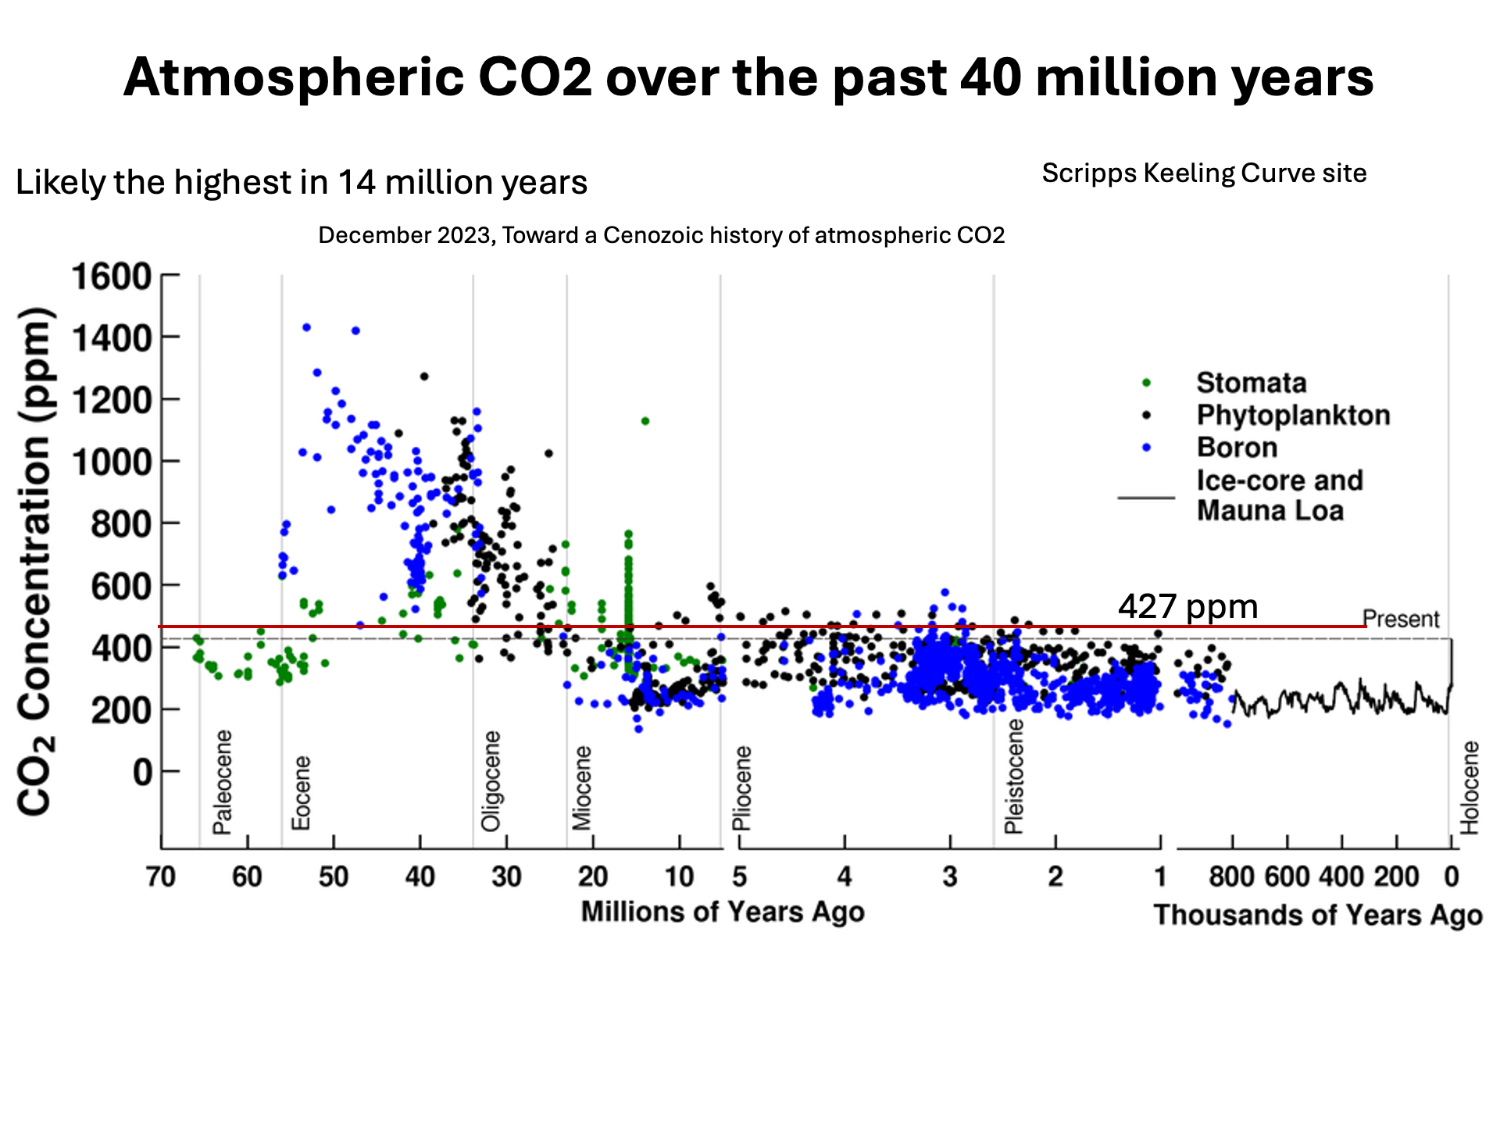
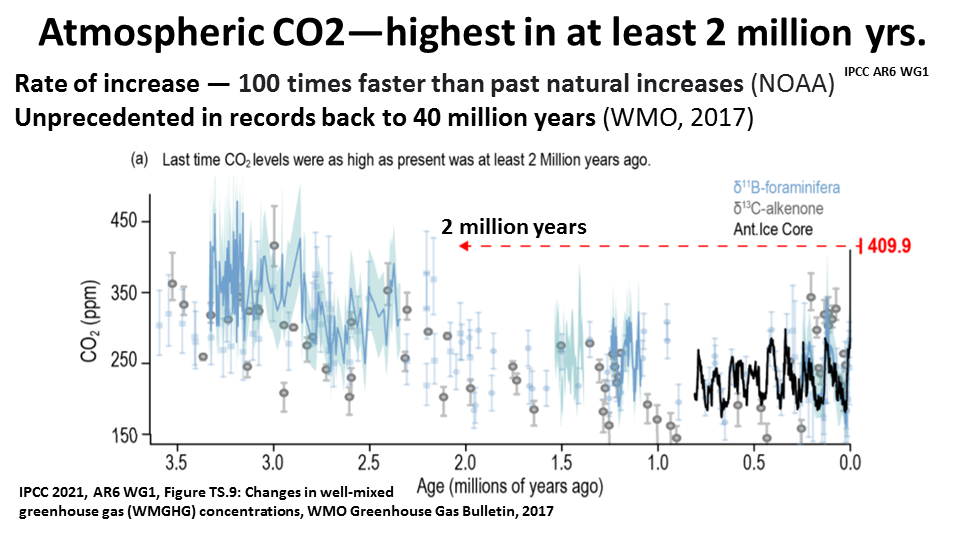
Atmospheric CO2 highest in 14 million years
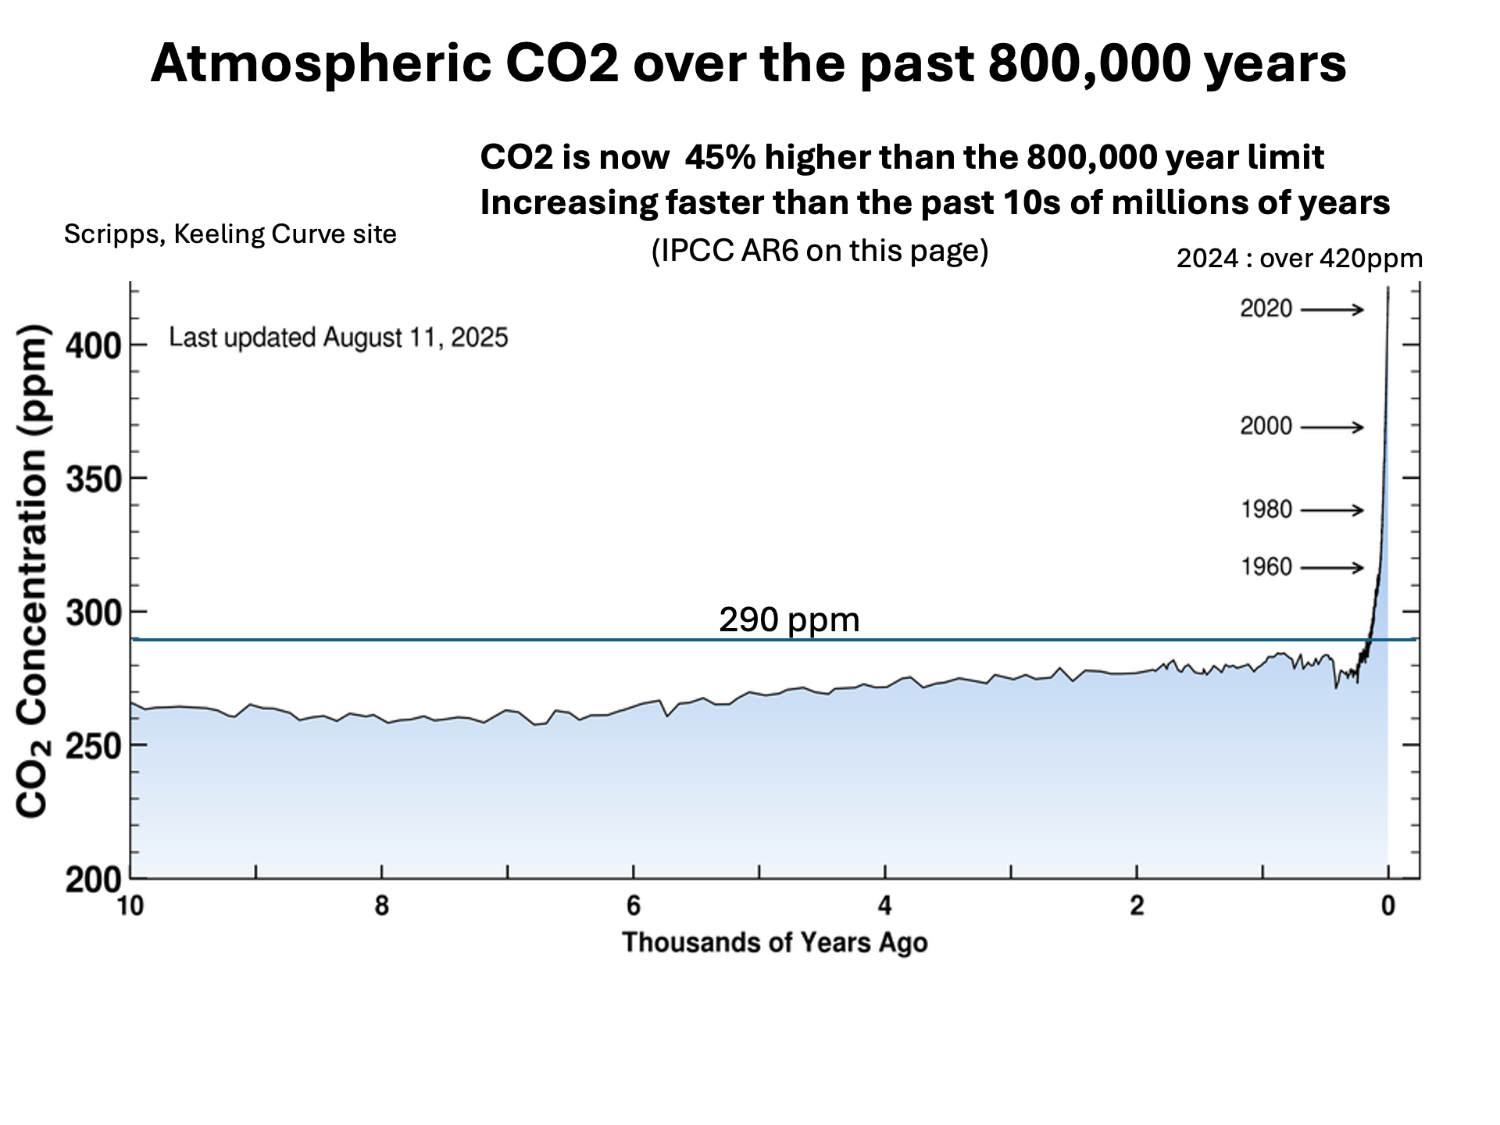
IPCC AR6: atmospheric over past 800,000 years
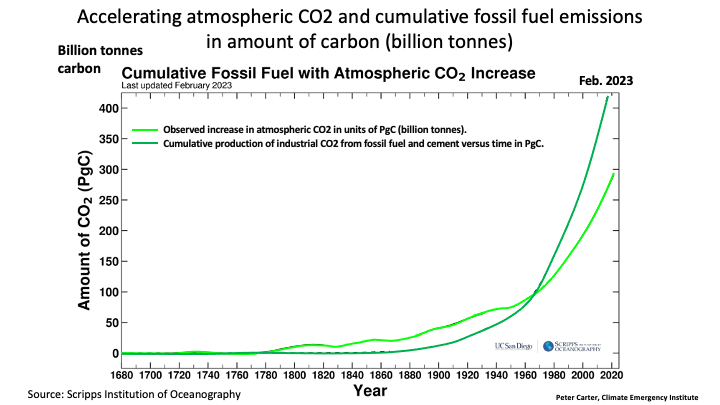
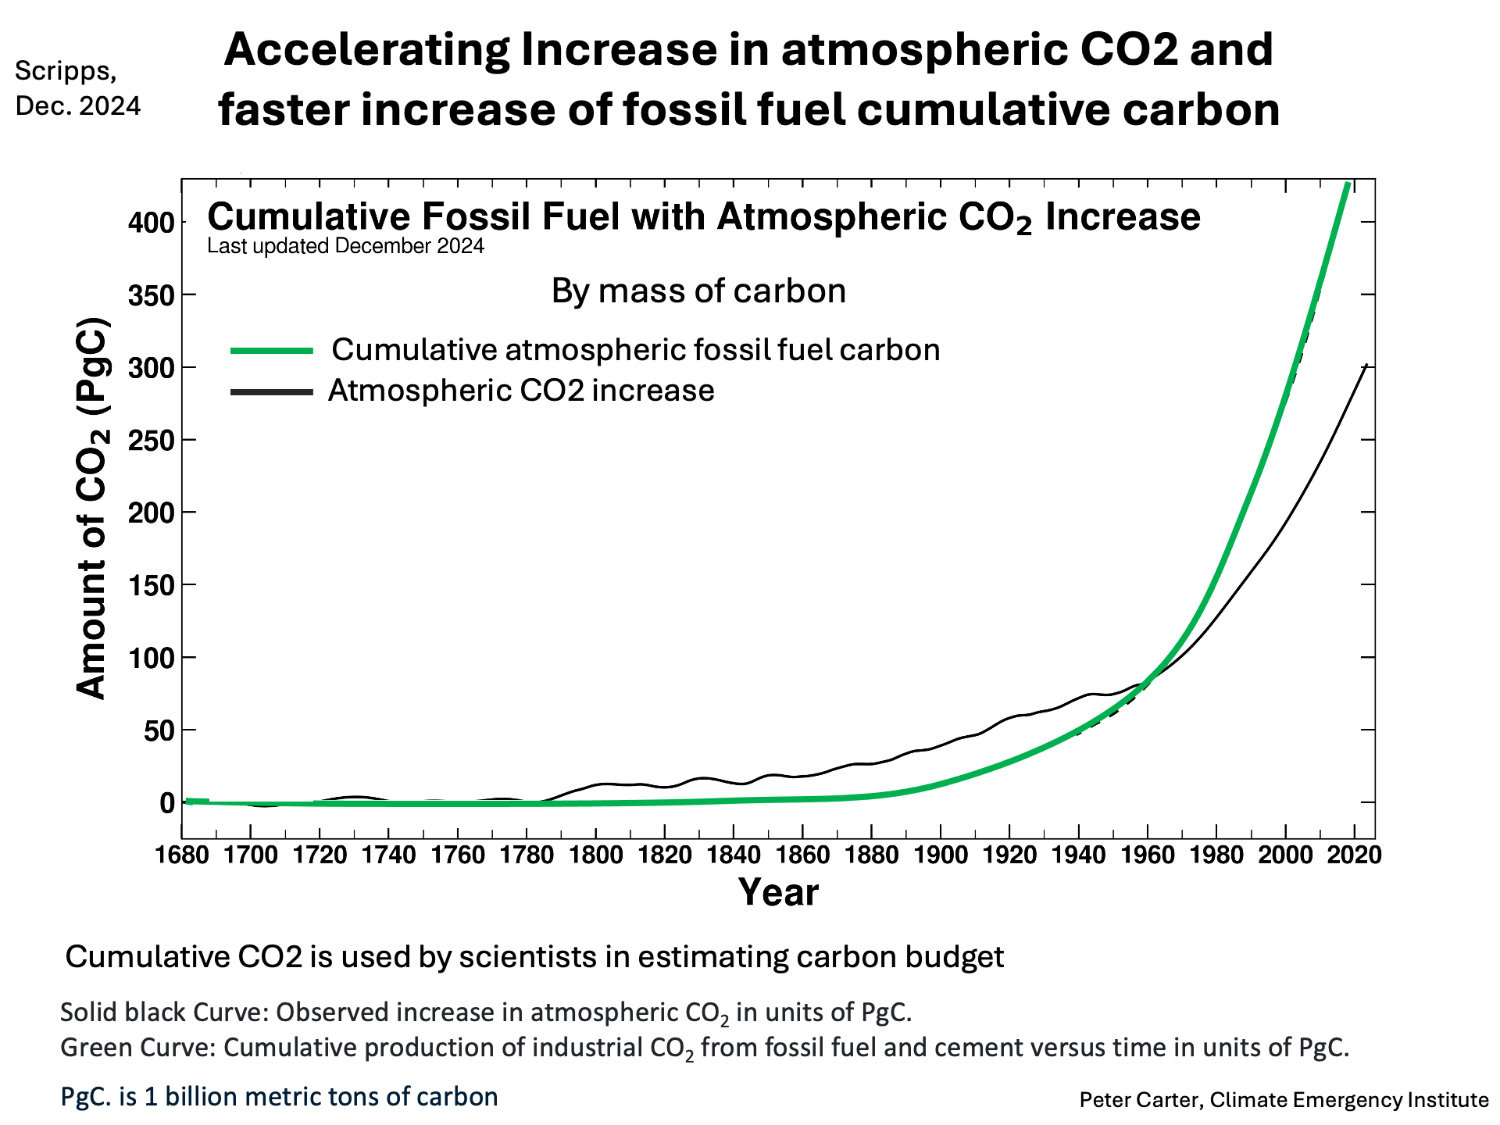
Accelerating fossil fuel atmospheric CO2 and cumulative CO2 emissions (tracking worst-case scenario RCP8.5)
State of Our Climate
Atmospheric CO2 Levels
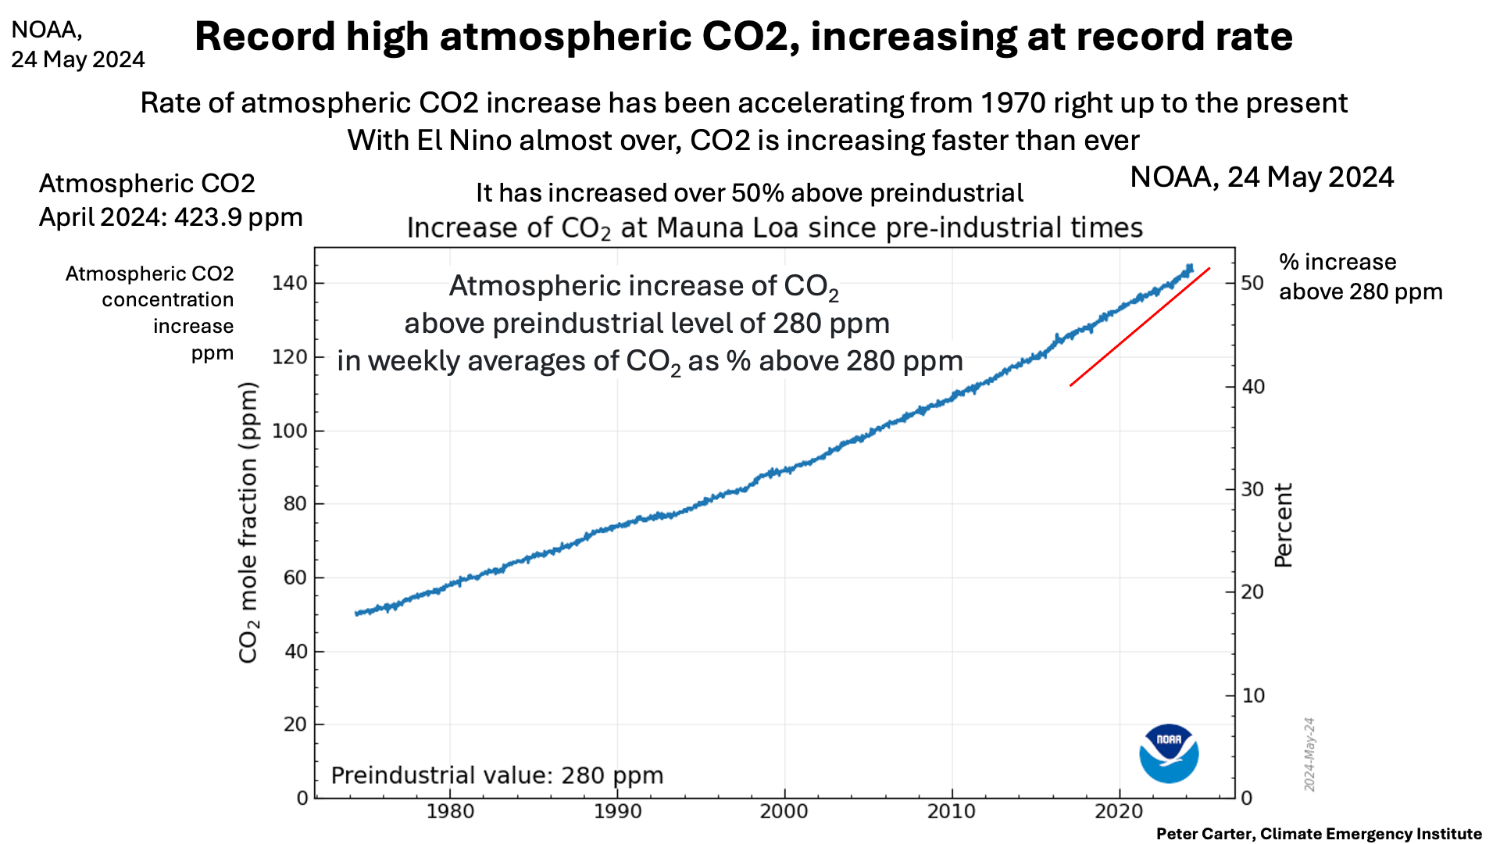
This is a new weekly CO2
as the %age above pre-industrial
Acceleration is clear right up to present
as the %age above pre-industrial
Acceleration is clear right up to present
WMO Greenhouse Gas Bulletin 2017
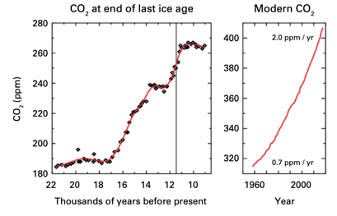
The rate of increase of atmospheric carbon dioxide (CO2) over the past 70 years is nearly 100 times larger than that at the end of the last ice age.
The rate of increase of atmospheric carbon dioxide (CO2) over the past 70 years is nearly 100 times larger than that at the end of the last ice age.
As far as direct and proxy observations can tell, such abrupt changes in the atmospheric levels of CO2 have never before been seen.
The figure shows the CO2 atmospheric content at the end of the last ice age, and the figure on the right shows recent atmospheric CO2 content. The thin grey area on the left figure, which looks like a vertical line, corresponds to a similar period of 70 years as depicted on the right figure for modern times.
CO2 concentrations posted by NOAA and Scripps show:
o Seasonally adjusted mean CO2 is main one used for policy
o NOAA also provides daily, weekly and monthly CO2
o Seasonally adjusted mean CO2 is main one used for policy
o NOAA also provides daily, weekly and monthly CO2
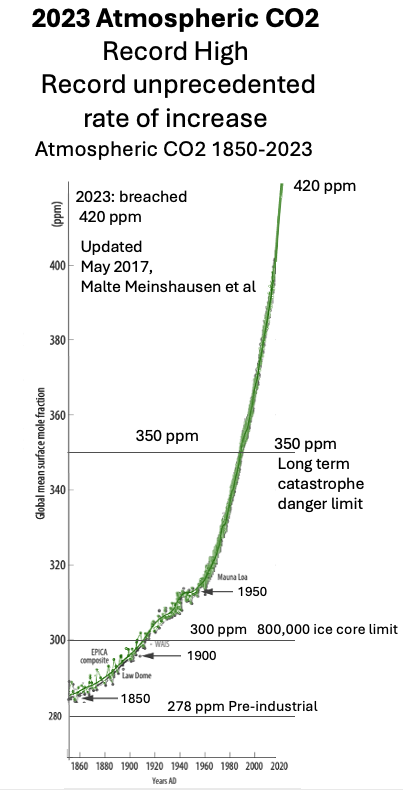
Unusual but more
realistic rendering
of record 2023
atmospheric CO2 level
and increase rate
realistic rendering
of record 2023
atmospheric CO2 level
and increase rate
Mean concentration
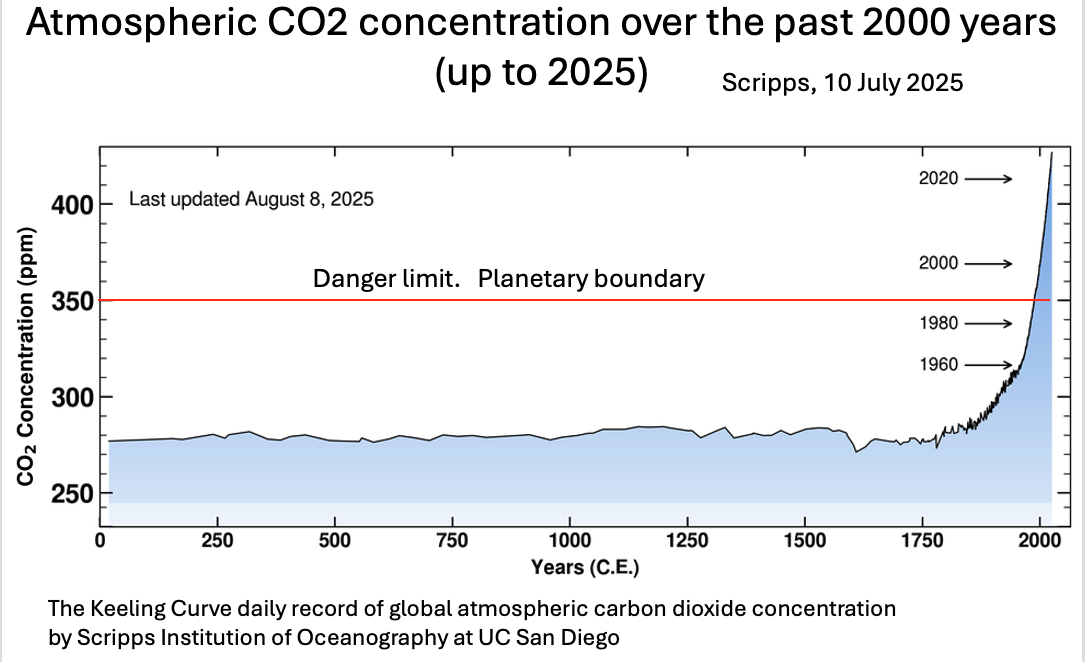
Quick video: Atmospheric CO2 concentration over the past 800,000 year's -- Abrupt increase - now over 420 ppm
ii